Hypothesis Testing
|
"The best material model of a cat is another, or preferably the same, cat."
~ Norbert Wiener
Quite often we wish to compare two competing hypotheses. We typically call the hypothesis that our treatment has no effect on our data the null hypothesis, H0. This may be that our new drug is no better than our old drug or, say, that our data match the theoretical value. An alternative hypothesis, Hi, is an hypothesis that may be true if H0 is not. Such a hypothesis may be, for example, that our catalytic converter has fouled, or that our results do not agree with a theoretical prediction.
Steps in Testing a Hypothesis of Means:
- Determine the sample means, m, sample standard deviations, s, and the sample size, n, of data sets a and b. If comparing to theory, then data set b contains only a single value. Therefore, nb would be 1, mb would be equal to the theoretical value, and sb would be 0.
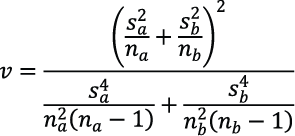
- Calculate the degrees of freedom, v.

Note how this equation simplifies if we are comparing to theory or if the sample sizes and/or standard deviations are equal. - Calculate sab, the unbiased estimator of variance:

- Calculate the test statistic, t:

- Calculate P using the values of t and v in the Student t-CDF:

where the beta functions in the numerators are incomplete beta functions and the denominators are beta functions. These values are typically found in tables or statistical software. The following applet, with t in place of x, may also be used to calculate the CDF value:
- Calculate the probability that your particular hypothesis is true, using a one tail or two tail test:
H1H0TailsEq. for Prob. That H1 is Trueμa ≠ μbμa = μb21 - 2 * Pμa > μbμa = μb1P if ma < mb and (1 - P) otherwise.μa < μbμa = μb1P if ma > mb and (1 - P) otherwise.
To see an graphical depiction of this process, and to perform a hypothesis test on your own data see the interactive applet, below.
Other sorts of tests:
It is important to note that many other sorts of hypothesis may be tested in a similar fashion. One simply needs to calculate the appropriate test statistic and use an appropriate CDF for calculating P. The following table shows a summary of frequently used tests on means and standard deviations.
UNDER CONSTRUCCTION,
THE FOLLOWING TABLE IS NOT FINISHED:
| H0 | Given | Test Statistic | CDF |
| μa ≠ μb | Normally distributed data | Case detailed above | t |
| μa ≠ μb | Normally distributed data σa and σb are known |
 |
normal |
| σa ≠ σb | Normally distributed data |
|
F |
| σa ≠ σb | Normally distributed data σb is known |
 |
Chi2 |
These tests are shown for test data in the interactive below.
Interactive Hypothesis Testing Applet:
| Data Set A: (comma separated) | Data Set B: (or single, theoretical value) | ||||||||||||||||||||||||||||||||||||||||||||||||||||||||||||
|
|
|
|
|||||||||||||||||||||||||||||||||||||||||||||||||||||||||||
| Results: | |||||||||||||||||||||||||||||||||||||||||||||||||||||||||||||
|
|||||||||||||||||||||||||||||||||||||||||||||||||||||||||||||

