Confidence Intervals/Levels
|
"As far as the laws of mathematics refer to reality, they are not certain; and as far as they are certain, they do not refer to reality."
~ Albert Einstein
- Reasons for Reporting Error Values
- Terminology
- Confidence Intervals in Measurements
- Confidence Intervals in Means
- Interactive Confidence Interval Applet
Reasons for Reporting Error Values:
Say that I were to measure some physical property, with which you were completely unfamiliar, of some system, with which you were also completely unfamiliar. If I were to report to you that I measured 3.14 Bu (units of Butterfields), what sort of information would you truly have?
In all, you would have no useful information.
What if an average measurement of this unfamiliar system will range in a uniform distribution from 1 Bu all the way up to 5.98e24 Bu, and we just happened to land on 3.14 Bu? What if such a system always measured at 3.14 Bu, and only ranged plus or minus 0.0000001 Bu over repeated measurements? Even if I told you a Bu is a unit of length or temperature or some other familiar property, you'd still be greatly in the dark, without some idea of the scale of a Bu, by which to develop some idea of the reported number's usefulness. With an idea of scale and of the particular physical property we could then draw from past experience to tell us how meaningful and useful a measurement of 3.14 Bu actually is.
The fact is we all make intuitive assumptions about the confidence we should have in measurements and we apply those assumptions to most all measurements we encounter. If I tell you the maximum outdoor temperature yesterday was 74°F, you will very likely know I don't mean it could have been anywhere from -54°F to 94°F. You will also likely assume I don't mean to give the impression that I think the maximum outdoor temperature was exactly 74.000000 °F everywhere in our city. You are familiar with temperature, thermometers and our certainty in their measurements, and you make some passable assumptions about our confidence in a number like 74°F.
Broadly put, without some idea of the error in a measurement all our measurements would be useless. It is therefore important to bring confidence levels and intervals and error bars out of the realm of intuition in onto a more solid statistical ground.
Confidence Interval (CI)- A range that a measurement or statistical parameter is likely to lie within, given a certain probability. A CI is usually reported as x ± CI. Note that a CI is meaningless without an idea of how likely the value will fall in that range, a confidence level.
Confidence Level (CL) – The probability that a measurement or statistical parameter exists within the confidence interval. Usually reported with the CI: x ± CI (CL% Confidence Level).
Confidence Intervals in Measurements:
We may be interested in knowing the range which our measurements may take, or the likelihood of our next measurement being in some range. For example, we may wish to know how likely it is that our temperature in our coal gasifier will go above a certain value, for safety reasons. If we took multiple temperature measurements and found the measurement's histogram fit a PDF governed by a normal distribution, we could then use a normal CDF to satisfy our concerns. See the section on random variables for an explanation of PDFs and CDFs.
Given the mean and standard deviation in a run of data and assuming a normal distribution, we may determine our confidence interval by the following equation:
![]()
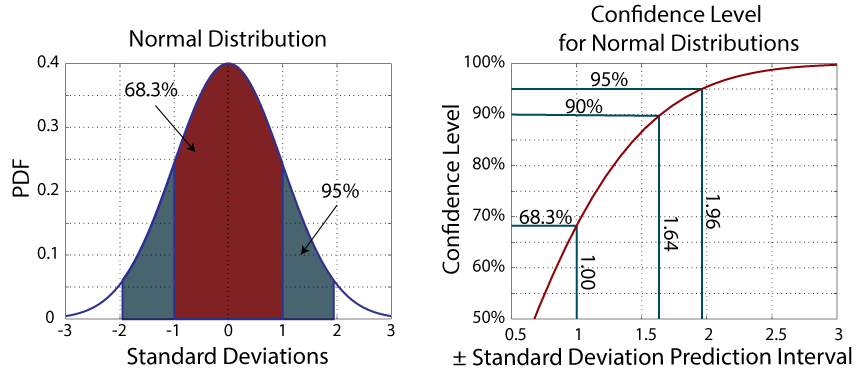
Graphically, our CI would represent areas under the measurement's PDF curve. Several important CIs are shown in the following figure depicting a normal CDF and the above equation for the CI, given a CL.

As the above figure illustrates, for normally distributed measurements, 68% of measurements fall within ± one standard deviation of the mean. If you want a 95% CL, then you need to go out to about two standard deviations.
Confidence Intervals in Means:
Quite often we do not care about the spread in our data but the mean of our data. As we take more and more measurements, we improve our hold on our population's mean, even while our confidence interval in our measurements remains broad. Given infinite measurements of a normally distributed random variable, in fact, we would know our population mean exactly.
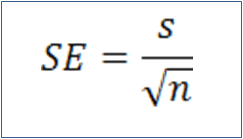
One often used means of representing confidence in a reported mean is the standard error:

where s is the sample standard deviation and n is the sample size. While this is often used, it leave us with no idea of the confidence level and may be misleading in some circumstances. Instead the following method is recommended.
Finding a CI for a Mean, Given a CL:
- Test for normalcy - This method assumes your data are normally distributed. See this page for methods of testing for normalcy.
- Choose a confidence level, CL. Typically, in published articles, a CL of 95% will be chosen. 99% and 90% are also common.
- Calculate a percentage, Pt.

The following figure graphically illustrates the origins of the equation for Pt:

- Calculate a t statistic, t, using the inverse CDF of the student t distribution with degrees of freedom, v, equal to the sample size, n, minus 1.

The following applet may be used to calculate the inverse of the t-CDF:
- Calculate a confidence interval, CI.

This process is demonstrated in the following interactive applet.
Interactive Confidence Interval Applet:
This applet graphically illustrates the process of calculating a CI with a given CL (or the inverse). Also, a test for normalcy is included. Mouse over an item to see a description.
| Enter or paste your data here (comma separated): | Or use synthetic data: | |||||||||||||||||||||||||||||||||||||||
|
|
|
|||||||||||||||||||||||||||||||||||||||
| Results: | ||||||||||||||||||||||||||||||||||||||||
|
||||||||||||||||||||||||||||||||||||||||